Even when LabVIEW applications are tested and released, there are faults, warnings, and notifications that are expected to occur under certain circumstances. These faults, warnings, and notifications are all types of alarms, and they can be handled by utilizing the alarm handler toolkit.
Defined Alarms
The alarm handler toolkit allows developers to define a set of alarms relevant to a given system. Each alarm definition includes a severity level and description. The description explains the alarm and any possible recovery steps to the user. This application-specific message can be significantly more helpful to the user than a generic LabVIEW error message aimed to inform the developer of a potential problem with the code. The alarm severity level helps dictate how the program will respond to an alarm occurrence.
Different applications may have a different response and recovery for each severity level. In general, these responses range from a notification that will display a message to the user without interrupting program execution to a critical alarm that will cause the system to stop any tests and go to a safe state. In addition to program responses based on the severity level of active alarms, developers can also create custom program responses to specific alarms.
User Interface
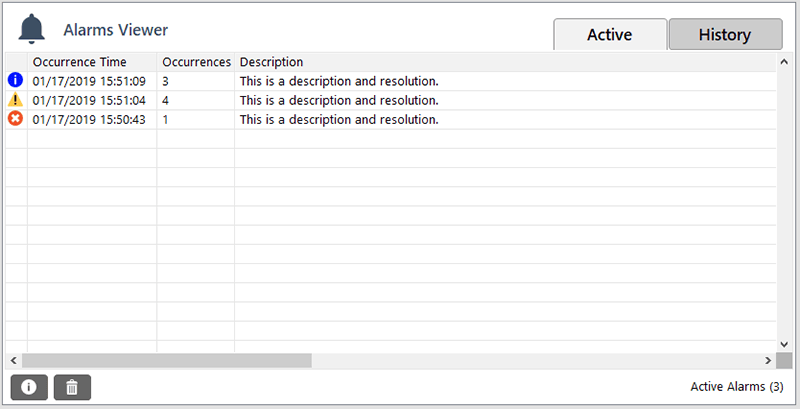
The alarm handler toolkit includes an optional user interface for PC applications, pictured below. The interface shows the user a list of active alarms with the following properties:
- Alarm Type
- Time of Occurrence
- Number of Occurrences
- Description/Resolution Steps
Historical Alarms
There is also a historical alarms tab that allows the user to view all alarms that have occurred in the current application session. Each alarm’s severity is represented by a different icon in the far-left column of the alarm table. From this HMI, users can clear alarms to trigger program recovery by pressing the Clear Alarm (trash can icon) button at the bottom.

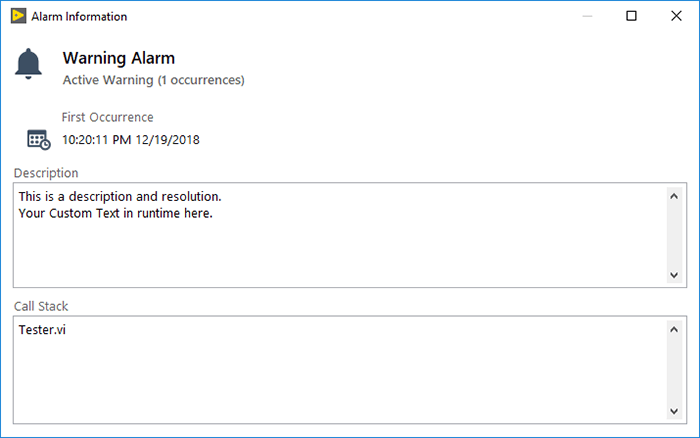
The user can also double-click on an alarm in the list to view a popup (shown below) with slightly more detailed alarm information.

If this interface does not meet the needs of a specific application, the alarm handler toolkit can still be used to keep track of the active and historical alarm lists behind the scenes. A custom interface can be developed that better suits the application’s needs.
Log Alarm Information
The alarm handler toolkit also generates text file logs purely for alarm information. From one file, someone can review the various alarms that occurred on a system, which can help trace down root cause issues. These logs utilize DMC’s LLAMA logging toolkit. An example log is shown below.

The alarm handler toolkit is lightweight and is generic enough to be a great fit for a wide variety of applications. DMC engineers have spent a significant amount of time developing this tool and vetting it in a variety of projects. All those efforts can be leveraged to efficiently implement effective alarm handling in your application. We’re excited to continue using this toolkit on new projects and extending the capabilities of it to make it ever more useful for our end clients.
These features are part of a powerful suite of tools called the DMC Flex Framework. Find out more about all of these tools here.
Learn more about DMC's LabVIEW programming expertise.