All industries continue using the Internet-of-Things (IoT) to collect, monitor, and analyze data. One popular IoT option is using Azure IoTHub, which this tutorial will focus on.
Connecting IoT Devices to an IoT Edge device allows for data processing to be even faster since an IoT Edge device allows you to analyze data closer to your IoT devices. This gives you the advantage of preprocessing data prior to sending it to the cloud.
In this article, we will review how we can get data running on an ASP.NET application of a child device to an OpenTelemetry Collector module running on an IoT Edge device up into Application Insights in the Azure cloud. Since the application is running on a separate device than the device running the OpenTelemetry Collector module, this example can be used to send trace and metrics data to Application Insights when an IoT device does not have direct access to the internet but the IoT Edge device does.
OpenTelemetry is a framework and toolkit to manage telemetry data. It provides a protocol that specifies how telemetry should be formatted and set. OpenTelemetry is favorable to use since it is vendor and tool-agnostic and can be used with different Observability backends such as Jaegar and Prometheus. Additionally, OpenTelemetry provides SDKs to implement clients in different languages, including .NET.
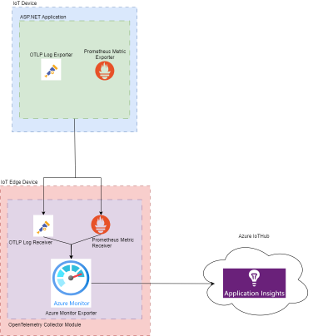
Prerequisites
- Visual Studio 2022 Preview
- Docker Desktop
- Application Insights resource in Azure
- Application Insights is not a totally free service, but Azure offers a free account that comes with $200 in Azure credits.
- IoT Edge device to deploy modules
- The IoT Edge device will be used to deploy the OpenTelemetry Collector module. You can follow this tutorial to setup your IoT Edge device and example module.
Implement the OpenTelemtry Exporter in ASP.NET Application
To get started, I created an ASP.NET Core Web App (Razor Pages) project with .NET 8.0 from the Visual Studio project templates.
Next, we will add an OpenTelemetry exporter to the service registration of our web application. There are a variety of exporters to choose from, but for this tutorial we will use Prometheus to export metrics and OpenTelemetry Protcol (OTLP) to export application logs.
I chose Prometheus for metrics since it is highly reliable when recording numeric time series data and it has an easy plug in to use with C# and ASP.NET. I chose OTLP for logs since it also has an easy plug in for ASP.NET and Prometheus does not support exporting traces.
The Prometheus Exporter relies on the following packages:
The OTLP Exporter relies on the following packages:
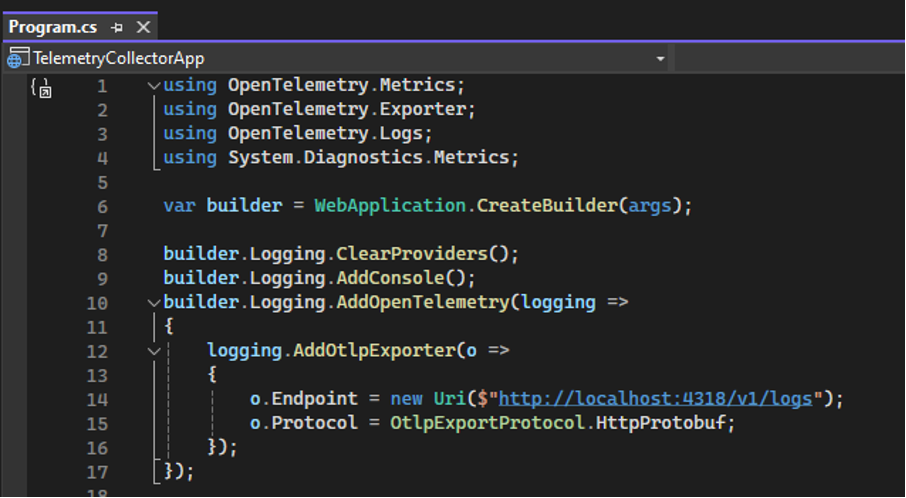
Your Program.cs file should look like the following:
- Configure logging to log to the console and to the OpenTelemetry OTLP Exporter. The IP address used for the OTLP Exporter endpoint should be the IP address of the IoT Edge Device. The default HTTP port is 4318 with the relative path of “v1/logs” as described here.
- Configure OpenTelemetry to use the Prometheus Exporter to export metrics. This example configures built-in metrics for “Microsoft.AspNetCore.Hosting” and “Microsoft.AspNet.Diagnostics.” It also configures metrics, for example, custom metric “HatCo.HatStore.”

- Configure the web application.

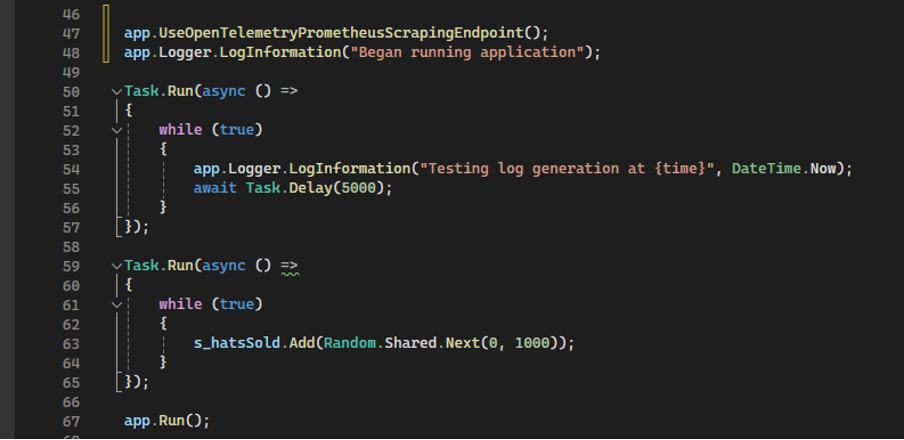
- Configure the web application to use the Prometheus scraping endpoint. Run background, test logic to generate logs and custom metric data for “HatCo.HatStore”. Run the application.
Add the OpenTelemetry Collector Module to your IoT Edge Device
We are going to test running the IoT Edge Modules in the simulator. This will allow the modules to run on your local Docker container registry.
Within your IoT Edge VS project, we will edit the “deployment.template.json” file to add the OpenTelemetry Collector module. The “modules” section should look like the following example.
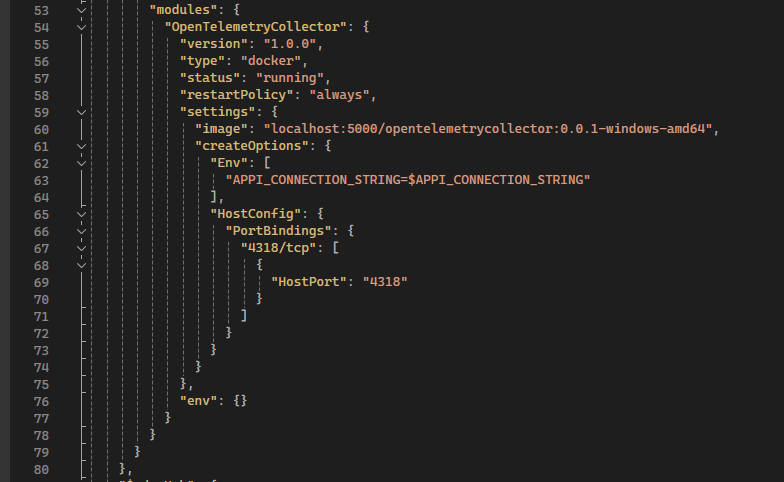
The image name should match the desired image name when we create the OpenTelemetry Collector image in Build the Module. The $APPI_CONNECTION_STRING is an environment variable on your local computer that can be set in a .env file within the VS solution. APPI_CONNECTION_STRING sets up an environment variable within the OpenTelemetry Collector module, and this variable is used in the config.yaml file for configuring the module which I'll detail in the next section.
Once the deployment file is edited, right-click the Edge project and select “Generate Deployment for IoT Edge."
Create the Configuration File for OpenTelemetry Collector
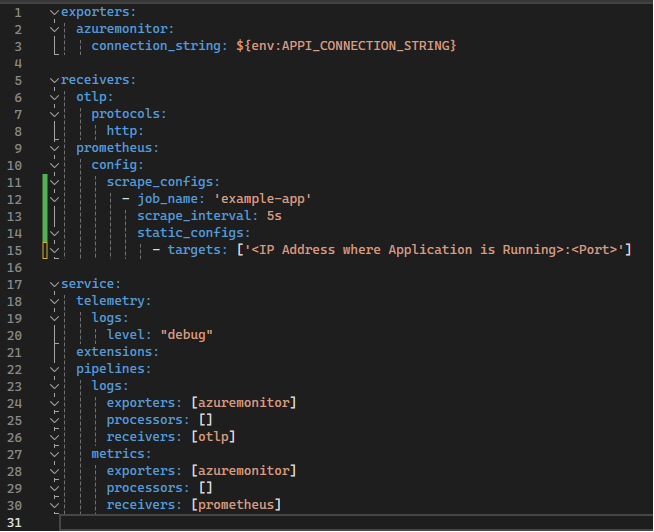
Before running the OpenTelemetry Collector module on our IoT Edge device, we will want to configure how the OpenTelemetry Collector module will receive data from exporters in our ASP.NET application and configure how the OpenTelemetry Collector should export the data it receives. The configuration for the module goes into a .yaml file. Your configuration file should look similar to the example below. You can add this config.yaml file into your IoT Edge solution that was created in the IoT Edge tutorial.
In this example, we have configured the OpenTelemetry Collector module to use a Prometheus receiver to scrape metrics. The Prometheus receiver on the OpenTelemetry Collector module has to actively scrape the endpoint where the child device is running the ASP.NET application. We then use Azure Monitor to report those metrics to Application Insights. For the “scrape_configs” section, the “targets” are the endpoints where you would like to scrape metrics from. You can have multiple “scrape_configs”. Note that as configured, Prometheus will scrape only from HTTP endpoints. If your ASP.NET project uses different ports for HTTP and HTTPS, ensure to provide the HTTP port.
We have also configured an OTLP receiver to retrieve logs. The default endpoint for the OTLP receiver using the HTTP protocol is http://localhost:4318/v1/logs which is what is configured for the OTLP exporter on the ASP.NET project. “localhost” here refences the Edge device. The logs are also exported to Application Insights via Azure Monitor.
Build the Module
To build the module in Docker Desktop, we will utilize the public OpenTelemetry Collector module image, and then we will copy our configuration file into it to modify the agent behavior. Create a Dockerfile to pull the OpenTelemetry Collector module image and copy over your configuration file. In the Dockerfile, we expose 4318 so that the ASP.NET application can push logs to our OTLP endpoint. The example Dockerfile below assumes that the Dockerfile and the config.yaml file are in the same directory.

Within a command prompt, navigate to the directory where your Dockerfile.amd64 file lives. Run the following command to build and push your image to your local Docker container registry.
docker build -t localhost:5000/opentelemetrycollector:0.0.1-windows-amd64 -f Dockerfile.amd64 .
Deploy the Edge Device and Collect Logs and Metrics
After generating your deployment file for the Edge device, right-click the Edge project and select “Build and Run IoT Edge Modules in Simulator.” This will run the OpenTelemetry Collector module from your Edge device on your local instance of Docker Desktop. You should see the logs for the OpenTelemetry Collector module trying to scrape your application metrics.

View Metrics and Logs in Application Insights
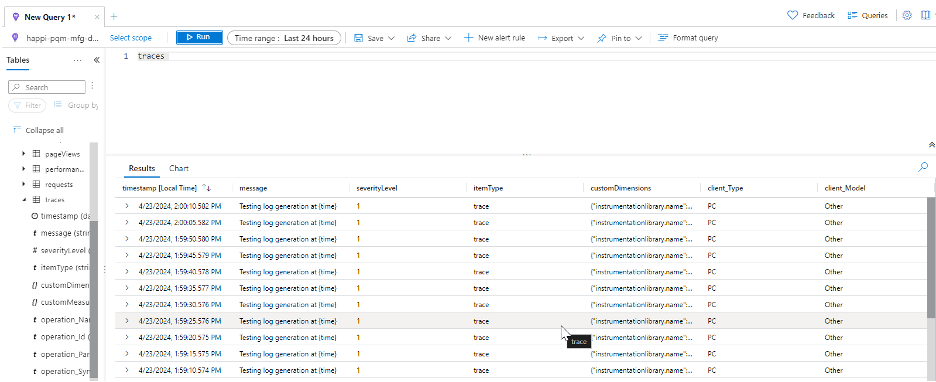
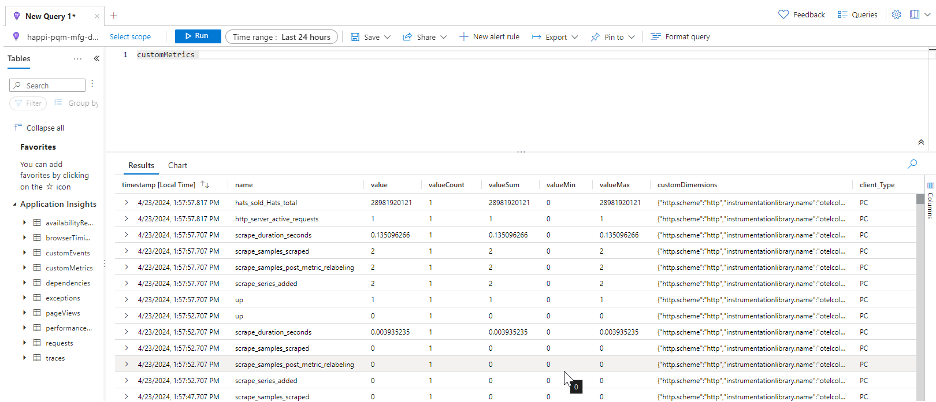
Once the Edge device is running, run your ASP.NET project. Navigate to your Application Insights resource in Azure Portal. In the left-hand navigation bar within the Application Insights resource under Monitor, select Logs. Query the logs for “traces” and “customMetrics.”
Under traces, you will see your application logs appear.
Under “customMetrics”, you will see your application metrics which includes the example metric “hat_sold_Hats_total."
Conclusion
With this tutorial as an example, you now have the ability to collect metrics and logs via an IoT Edge device from multiple applications!
Learn more about DMC's Application Development services and contact us for your next project.