If you’ve ever used a LabVIEW application that generates a lot of data very quickly, you’ve probably dealt with TDMS files.
TDMS files store data in a binary format that allows you to rapidly write data as waveform chunks. This works well for the kind of high-frequency data we handle often in the world of test and measurement. When working with LabVIEW, it serves as a complement to their DAQ API which reads high-frequency data in chunks from a hardware buffer. In contrast, writing such data to CSV files would usually require either writing data a few rows at a time or storing data in memory until it is ready to be written in uncompressed plaintext.
For all these reasons, it is a great format to write to except for the fact that reading TDMS files can sometimes be a hassle.
Currently, if you want to view TDMS files, you have a few options:
- DMC SuperViewer: I might be biased but our free downloadable utility to browse TDMS files is probably the best offline option.
- TDM Excel Add-In: This NI plugin lets you open your TDMS files in Excel. If your machine has an MS Office subscription, then it might be a viable option.
- NI DIAdem: A powerful application that lets you process multiple streams of data but requires an NI license.
- NI FlexLogger: As part of a larger feature set, NI FlexLogger allows you to view TDMS files. The Lite version is free.
These options all require a download and installation process.
As an alternative, we’ve developed a WebTDMS–a TDMS and CSV file viewer which you can open in your browser. There's no installation necessary! It is designed to be flexible with its many advanced analysis tools but easy to use with its clean interface.
Features
On the left side, you can drop in your various TDMS and CSV files to be read. You can also explore the example data that displays by default to test its various features. Let’s review the various tabs to see what features we have.

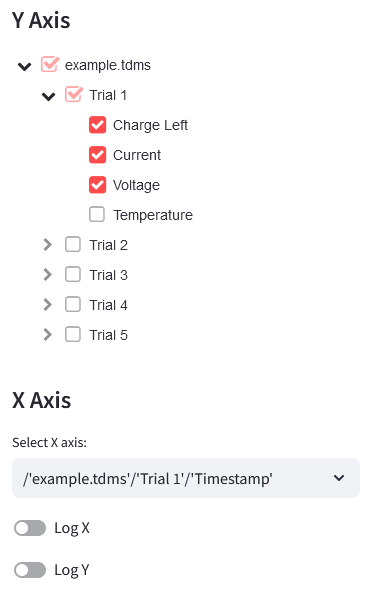
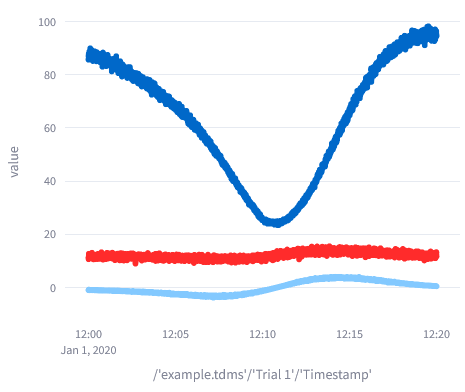
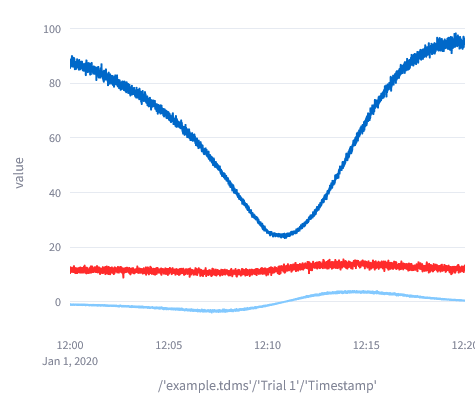
Charts
On the left side, you can select all the waveforms you would like to view in each file that you’ve uploaded. On the right side, you can view those waveforms as a scatter plot, line plot, or histogram.
Raw Data
You can view the raw data from your files next to each other and even download all your data as a single CSV file. You can even use filters to exclude rows where values for a column are outside your specified range.
Profiler
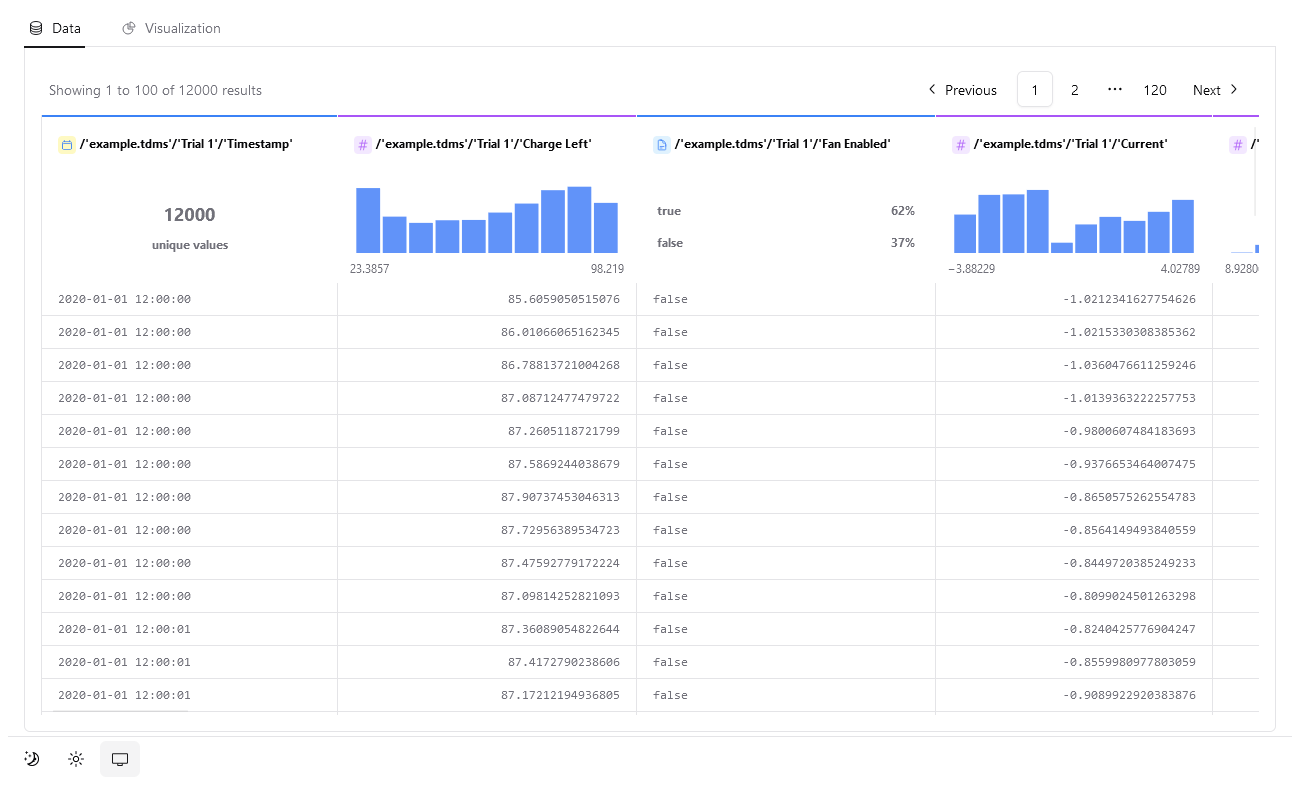
Data Tab
This section has a separate raw data viewer with paginated rows as well as an indication of the distributions of each column’s values.
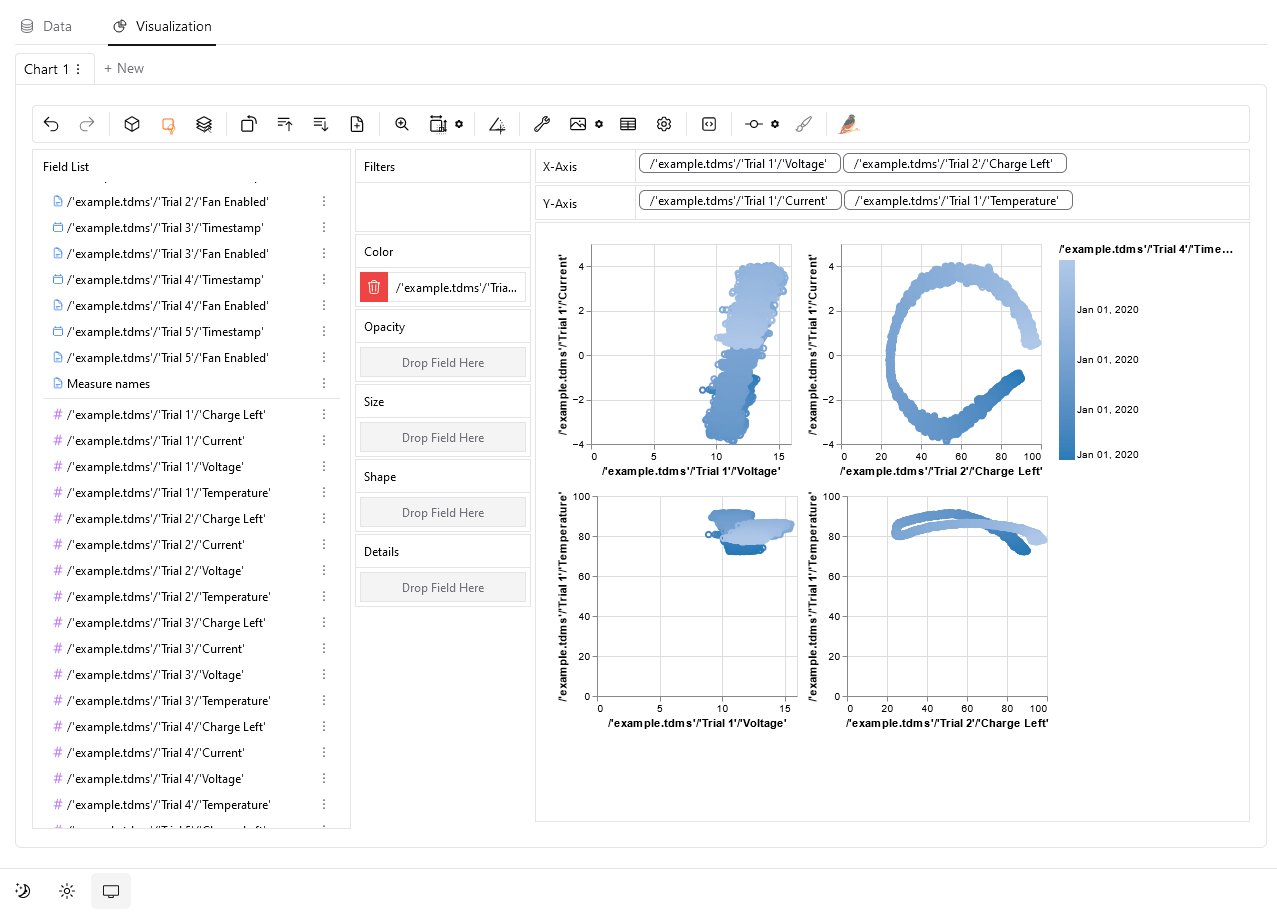
Visualization View
For a more complicated multivariate analysis of data, you can use the Visualization section.
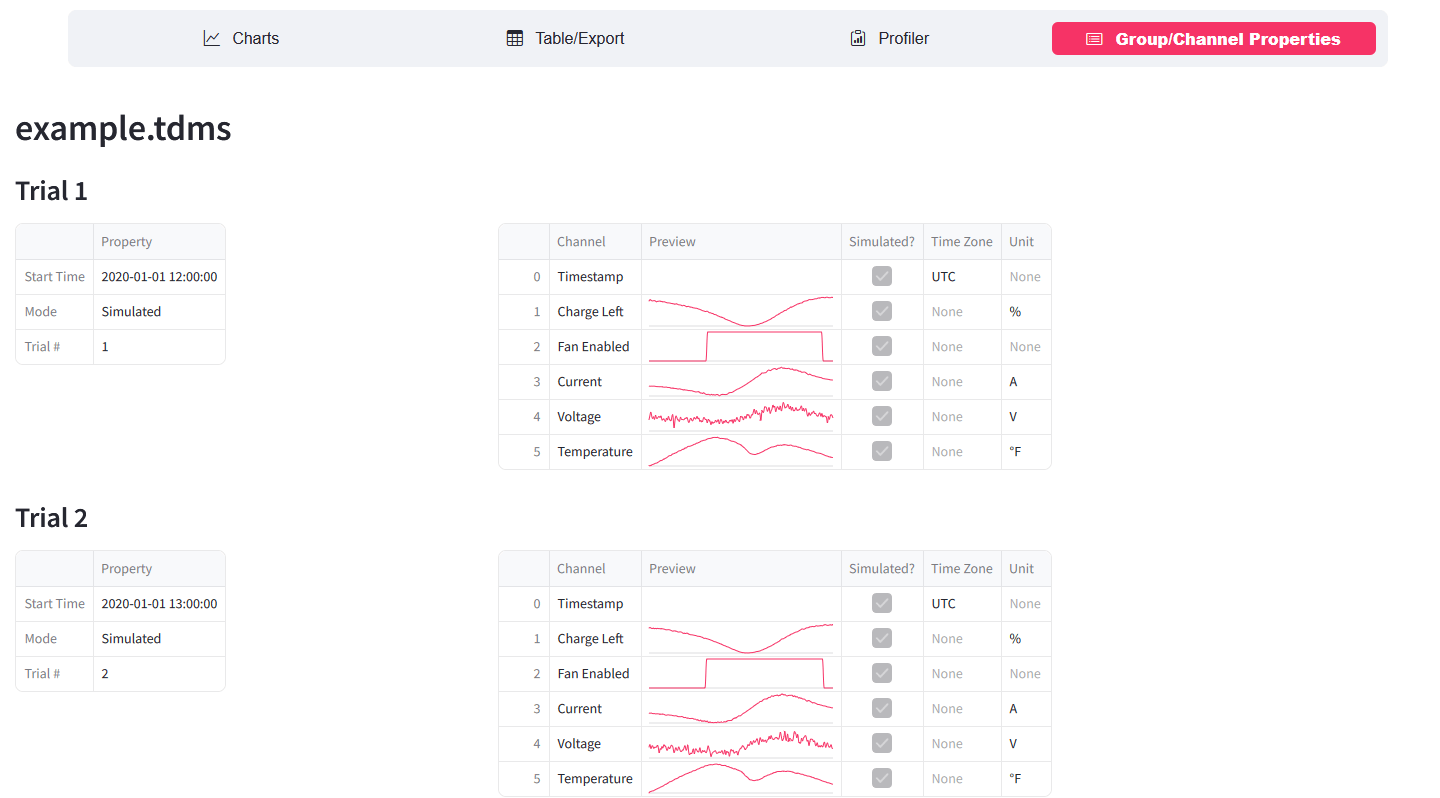
Group/Channel Properties
In this section, you can view the group and channel properties for TDMS files alongside a preview of each channel.
Calculated Channels
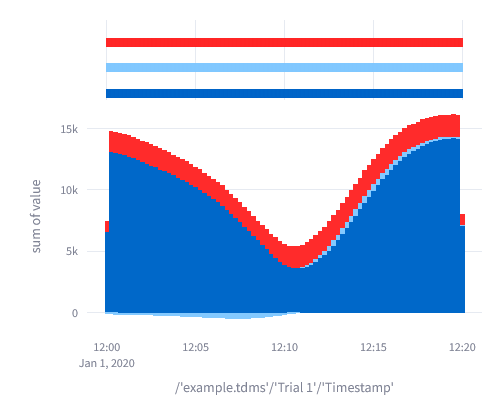
Finally, we have the flagship feature that lets you quickly perform mathematical analysis on your data. Taking inspiration from what makes LabVIEW great for data–that it is a dataflow language–this section allows you to create new channels that you can use in all the sections above using blocks of logic.
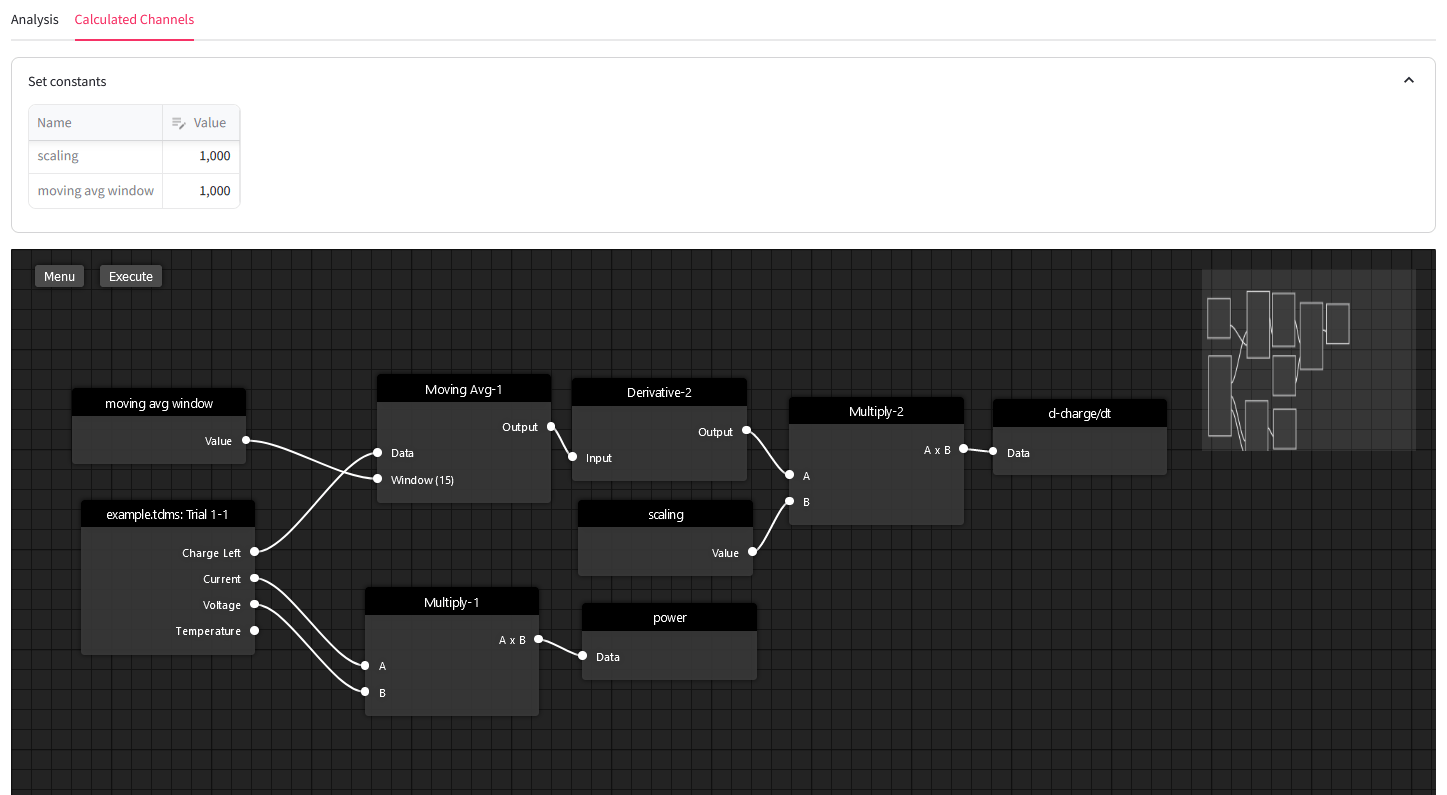
The logic above creates the chart below in the Charts section:

A public version of the app with a 50 MB file limit can be accessed at https://web-tdms.streamlit.app/. If you think this application is useful and that maybe a customized version of it would be perfect for your needs, please reach out to us!
Learn more about DMC's Test and Measurement Automation expertise and contact us for your next project.